I spend a lot of time in DevTools, and I’m sure you do too. Sometimes I even bounce between them, especially when I’m debugging cross-browser issues. DevTools is a lot like browsers themselves — not all of the features in one browser’s DevTools will be the same or supported in another browser’s DevTools.
But there are quite a few DevTools features that are interoperable, even some lesser-known ones that I’m about to share with you.
For the sake of brevity, I use “Chromium” to refer to all Chromium-based browsers, like Chrome, Edge, and Opera, in the article. Many of the DevTools in them offer the exact same features and capabilities as one another, so this is just my shorthand for referring to all of them at once.
Search nodes in the DOM tree
Sometimes the DOM tree is full of nodes nested in nodes that are nested in other nodes, and so on. That makes it pretty tough to find the exact one you’re looking for, but you can quickly search the DOM tree using Cmd + F (macOS) or Ctrl + F (Windows).
Additionally, you can also search using a valid CSS selector, like .red, or using an XPath, like //div/h1.
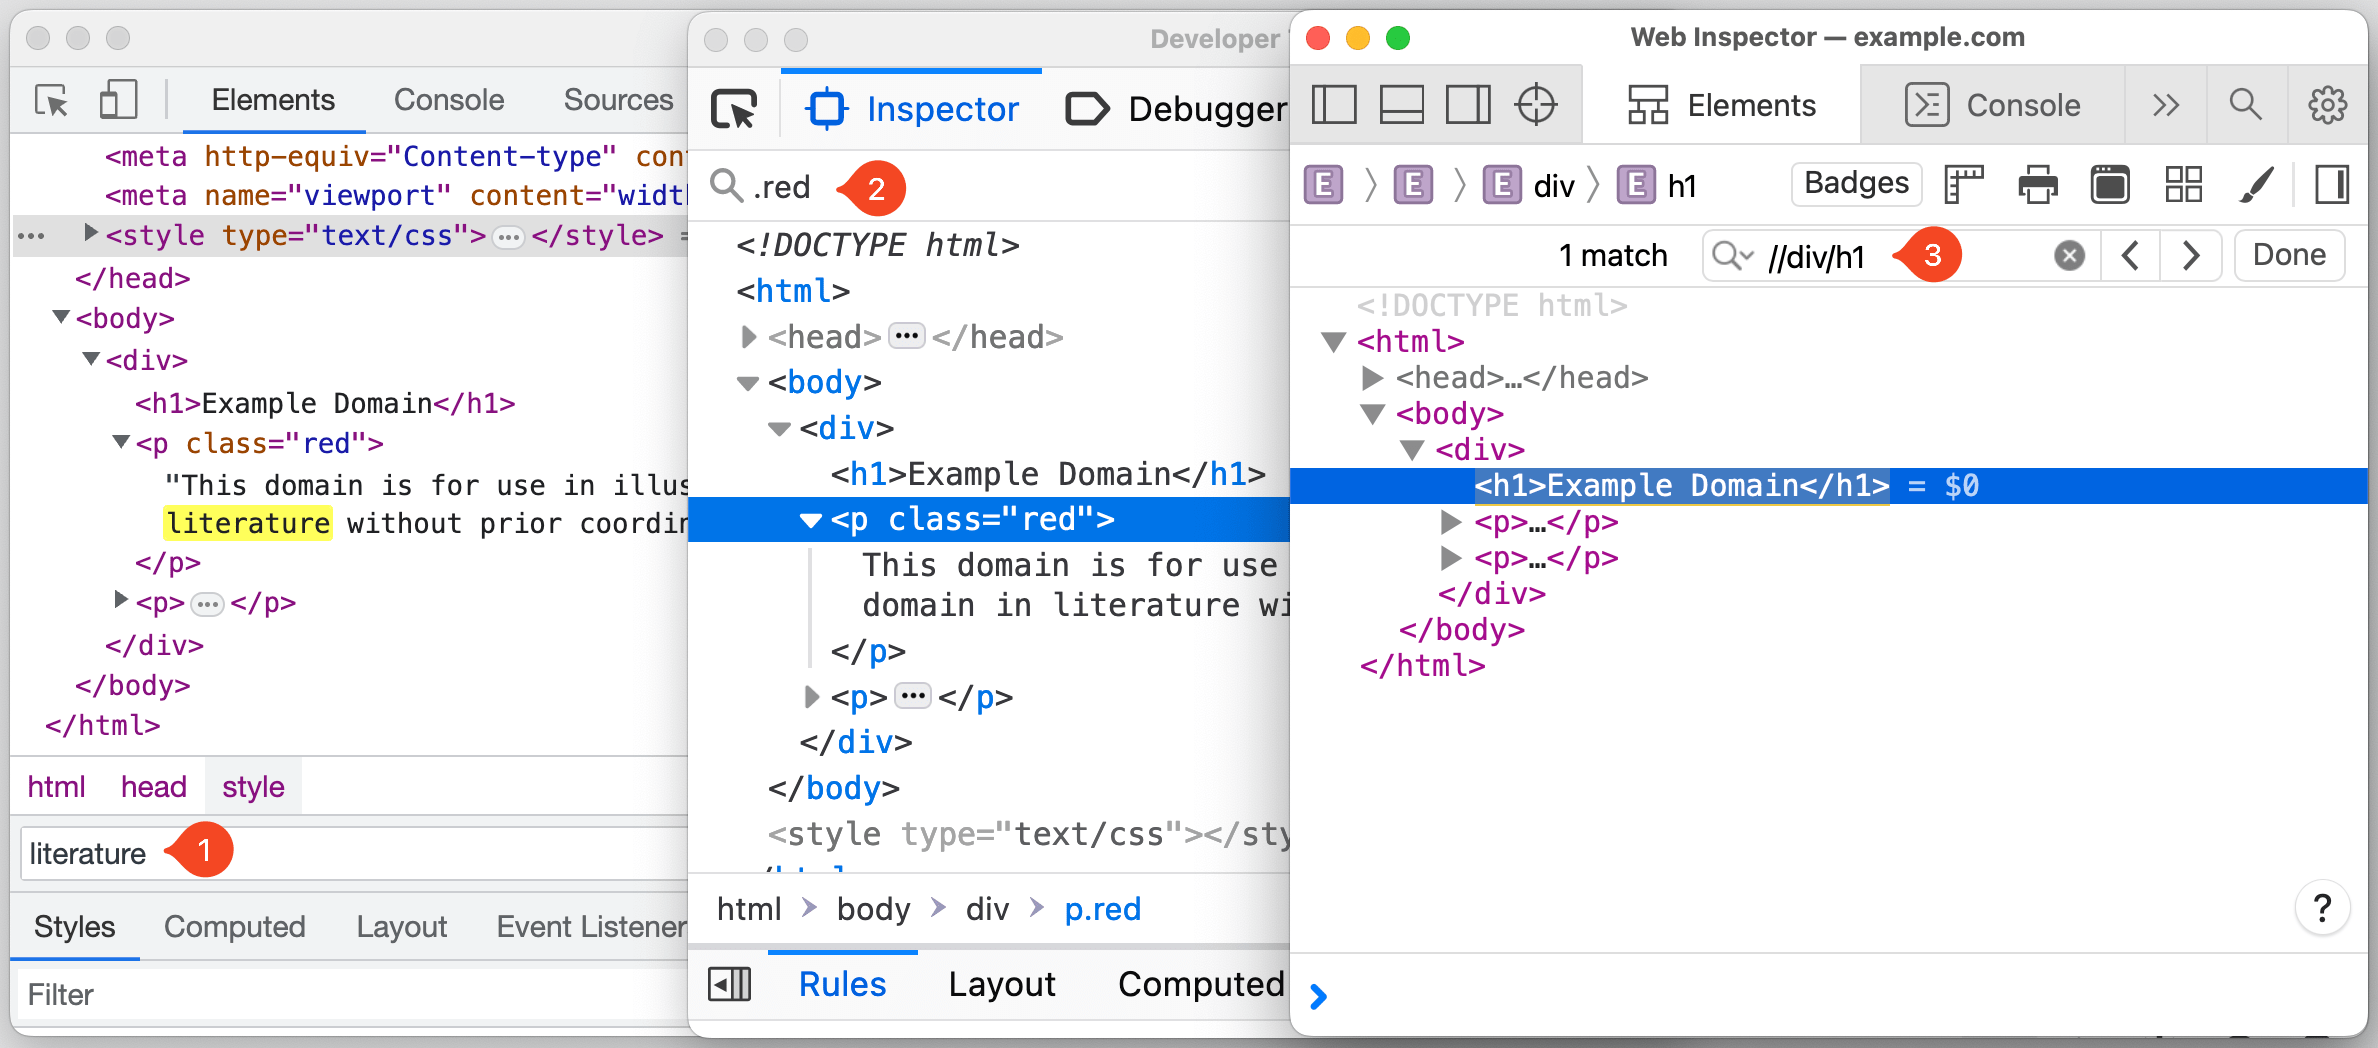
In Chromium browsers, the focus automatically jumps to the node that matches the search criteria as you type, which could be annoying if you are working with longer search queries or a large DOM tree. Fortunately, you can disable this behavior by heading to Settings (F1) → Preferences → Global → Search as you type → Disable.
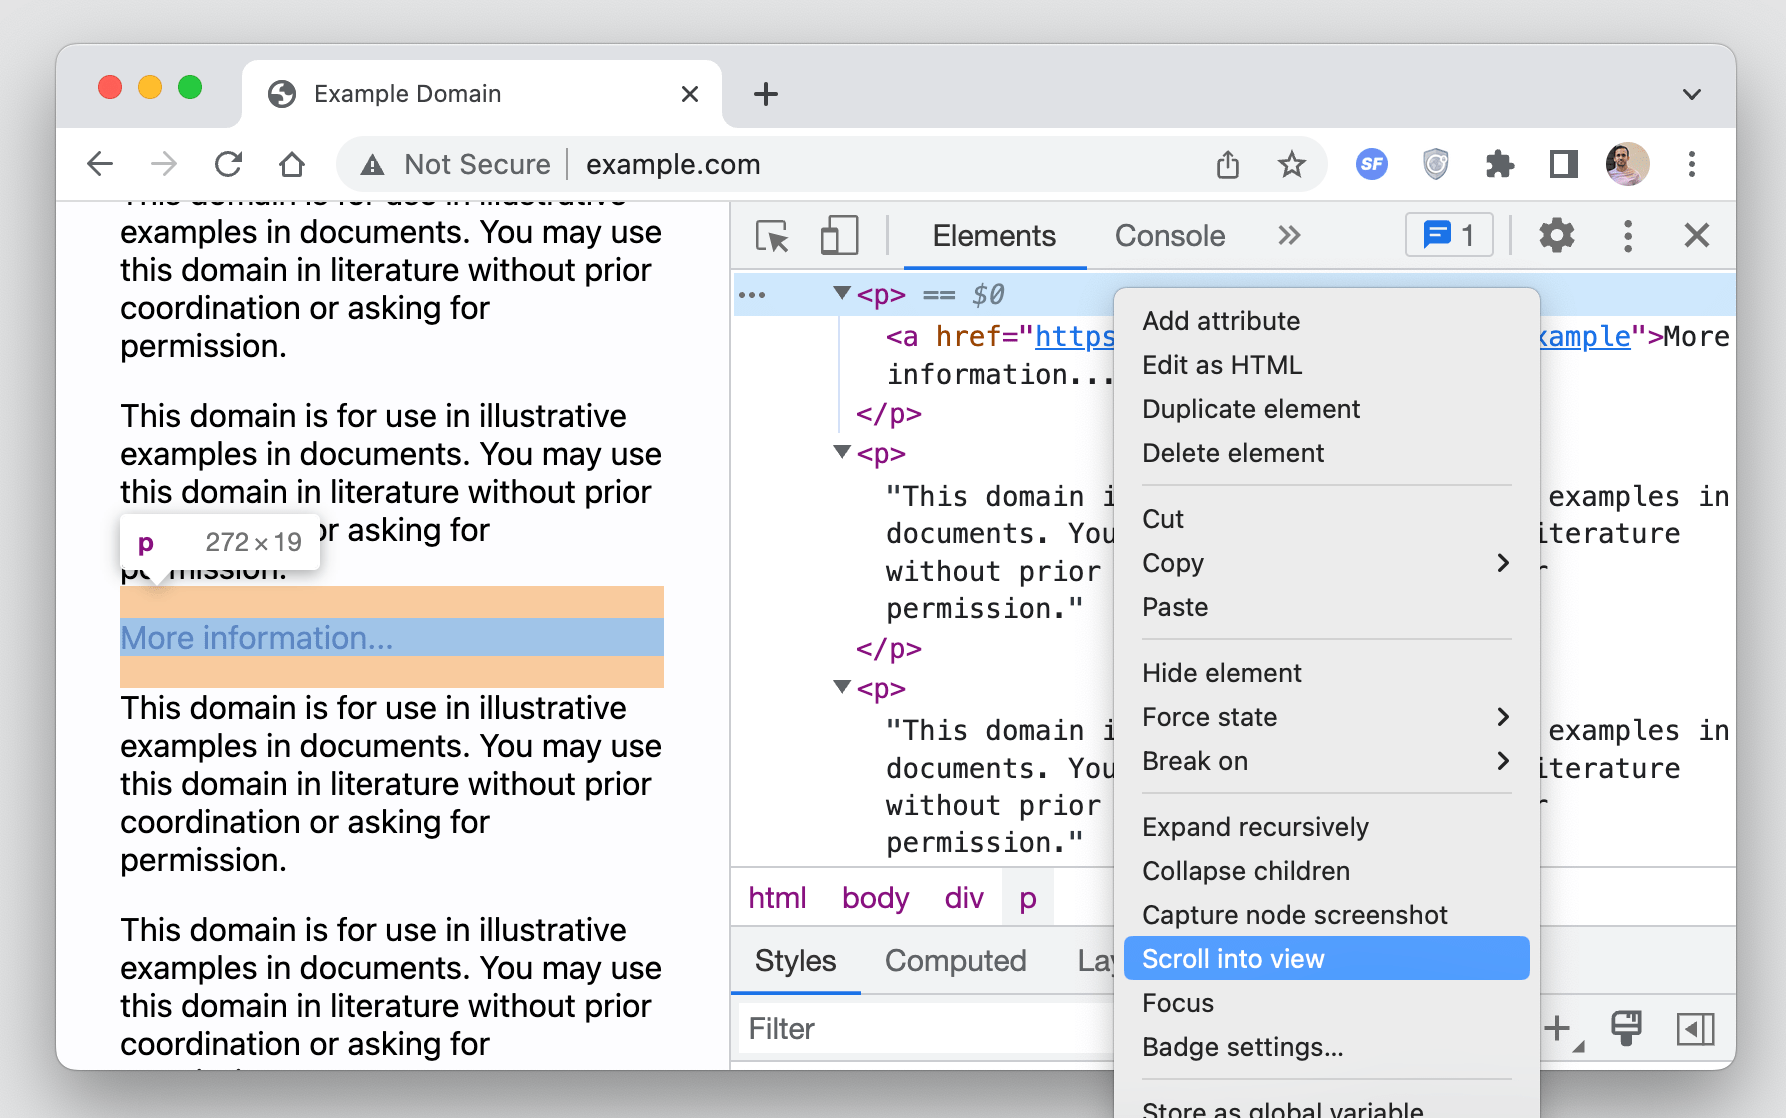
After you have located the node in the DOM tree, you can scroll the page to bring the node within the viewport by right-clicking on the nod, and selecting “Scroll into view”.
Access nodes from the console
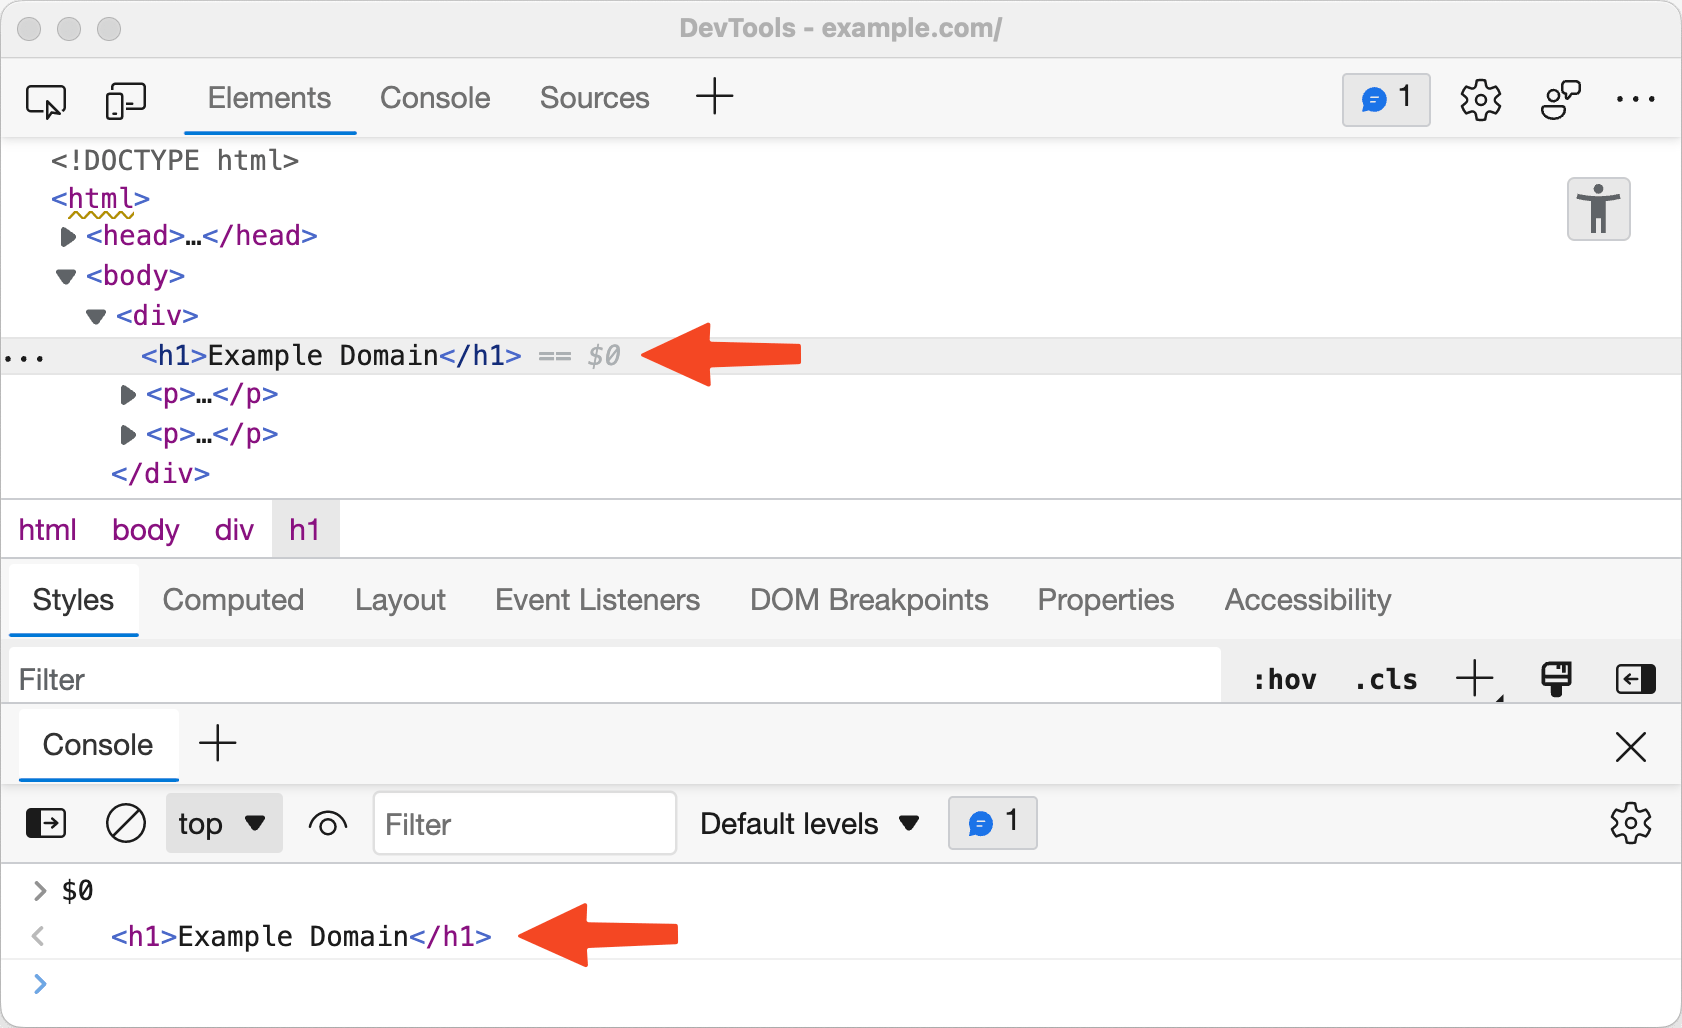
DevTools provides many different ways to access a DOM node directly from the console.
For example, you can use $0 to access the currently selected node in the DOM tree. Chromium browsers take this one step further by allowing you to access nodes selected in the reverse chronological order of historic selection using, $1, $2, $3, etc.
Another thing that Chromium browsers allow you to do is copy the node path as a JavaScript expression in the form of document.querySelector by right-clicking on the node, and selecting Copy → Copy JS path, which can then be used to access the node in the console.
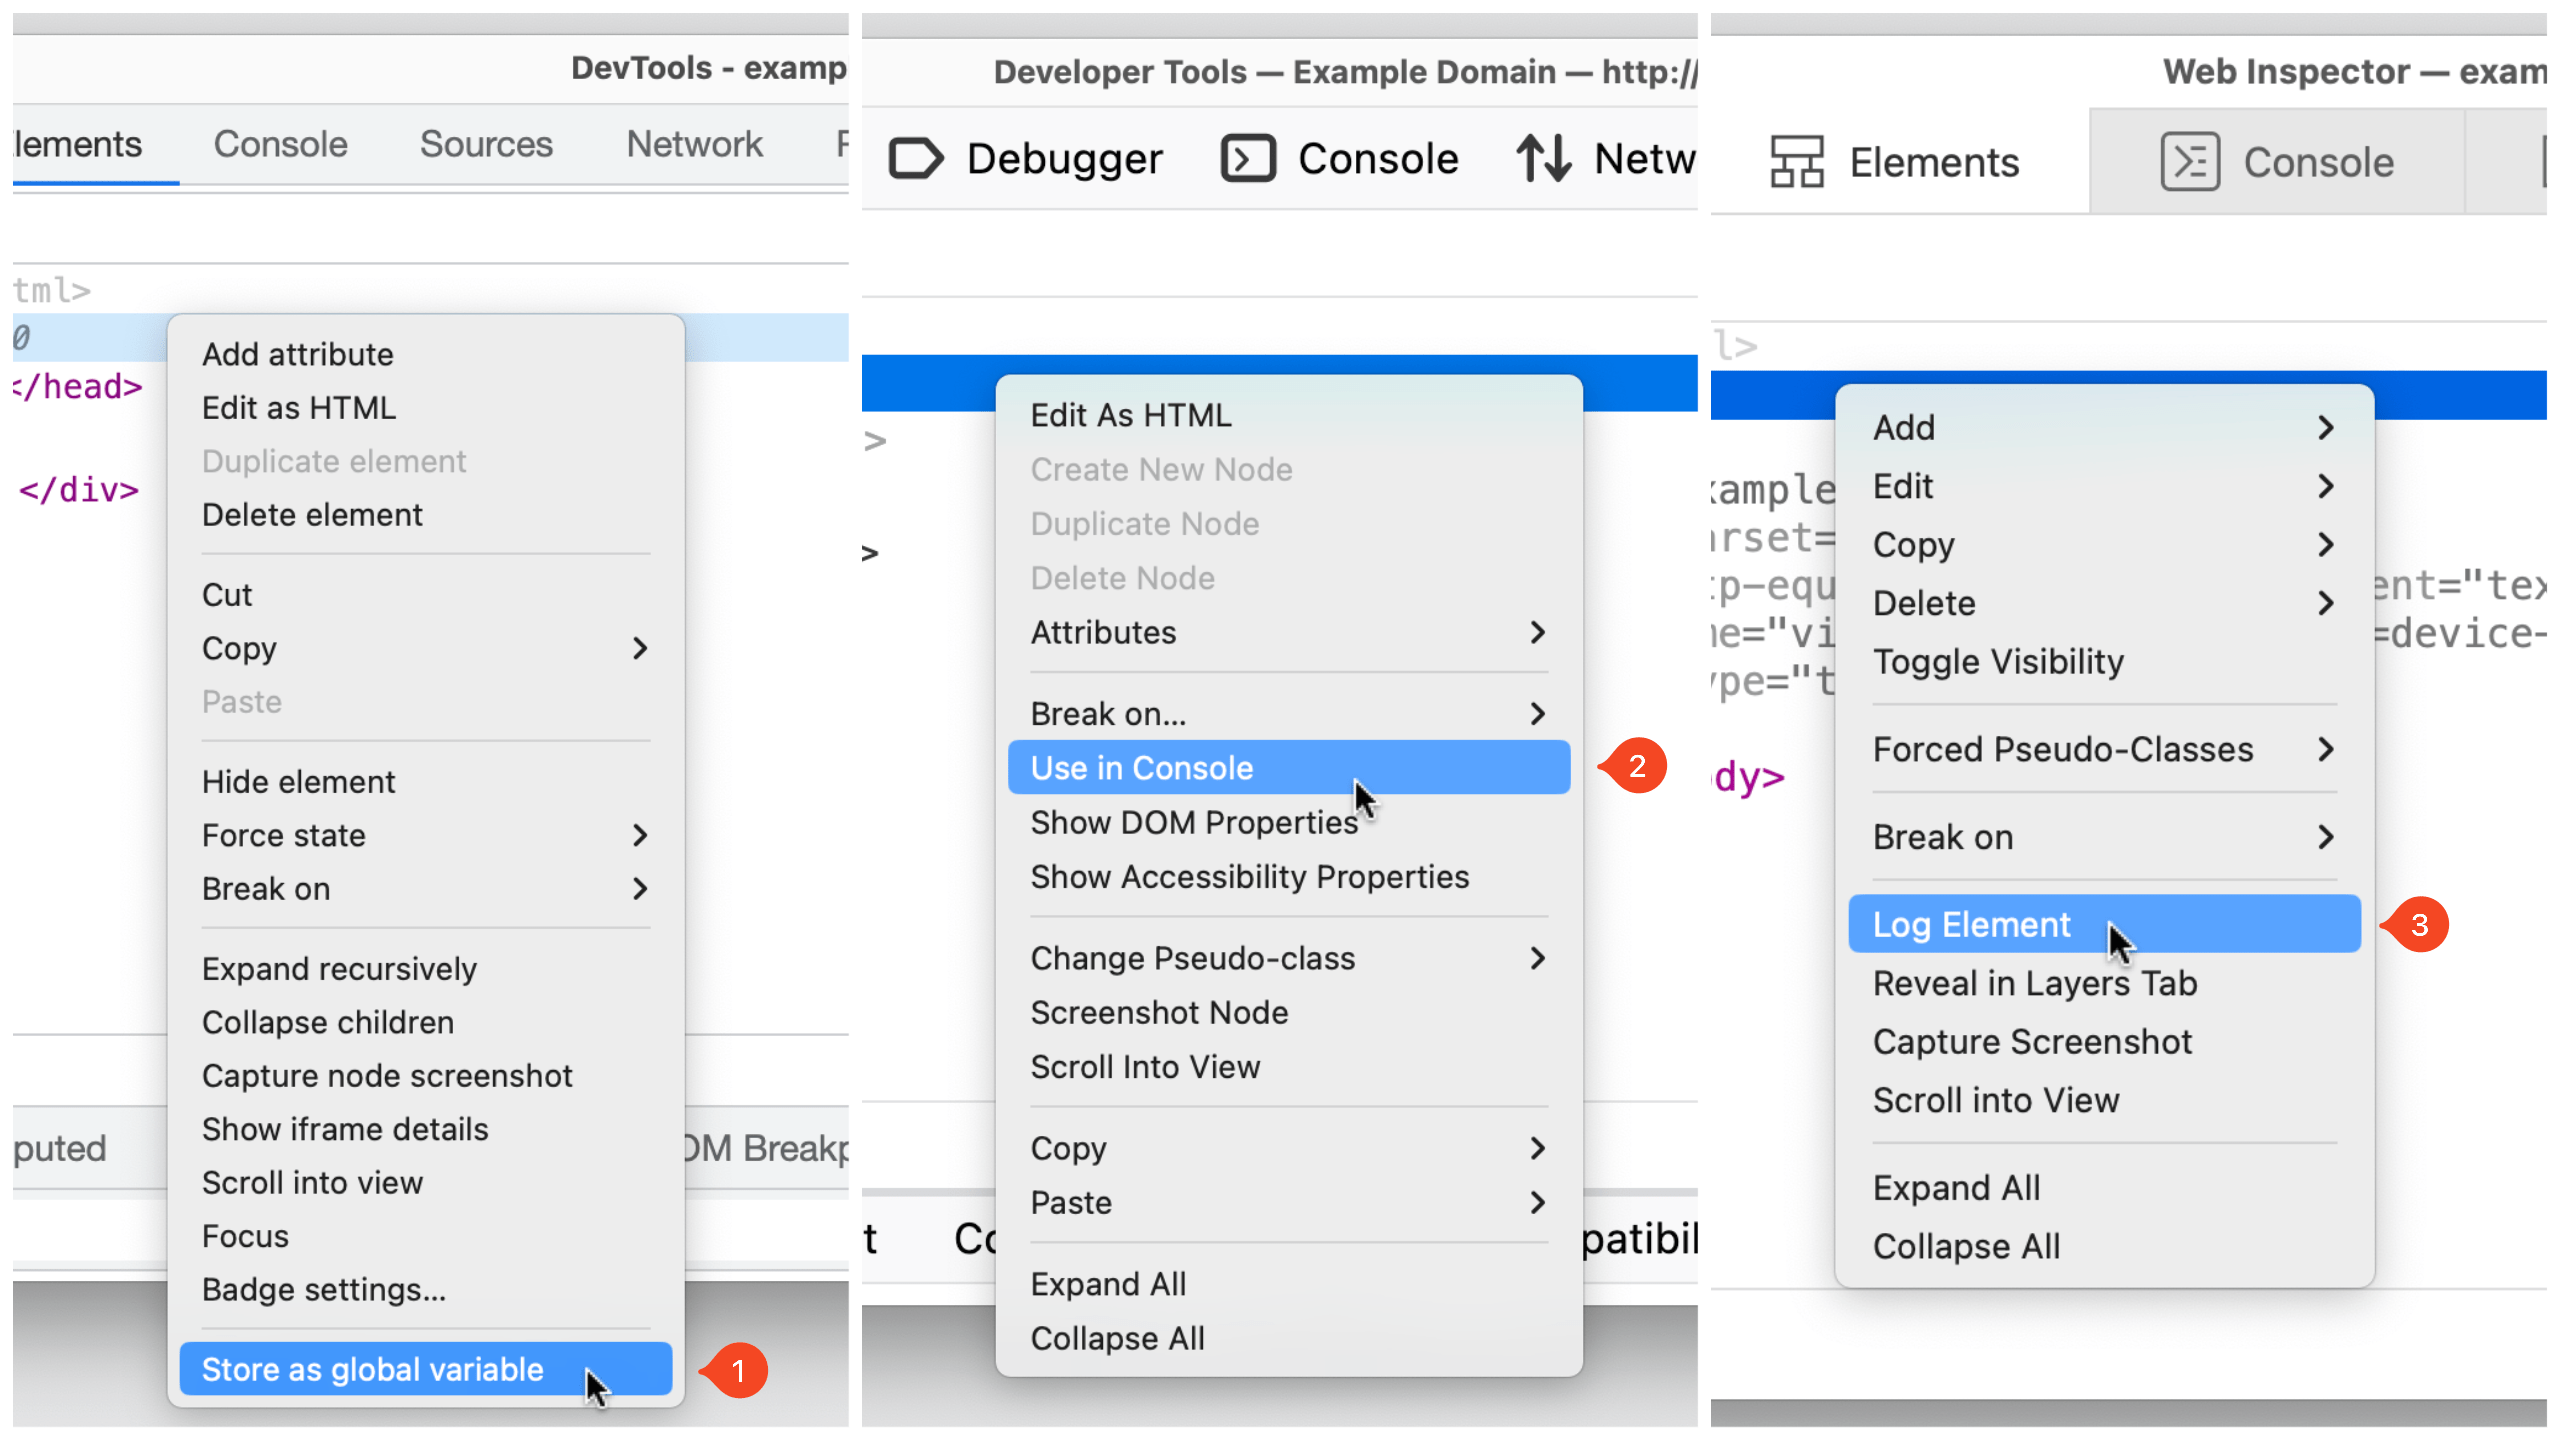
Here’s another way to access a DOM node directly from the console: as a temporary variable. This option is available by right-clicking on the node and selecting an option. That option is labeled differently in each browser’s DevTools:
- Chromium: Right click → “Store as global variable”
- Firefox: Right click → “Use in Console”
- Safari: Right click → “Log Element”
Visualize elements with badges
DevTools can help visualize elements that match certain properties by displaying a badge next to the node. Badges are clickable, and different browsers offer a variety of different badges.
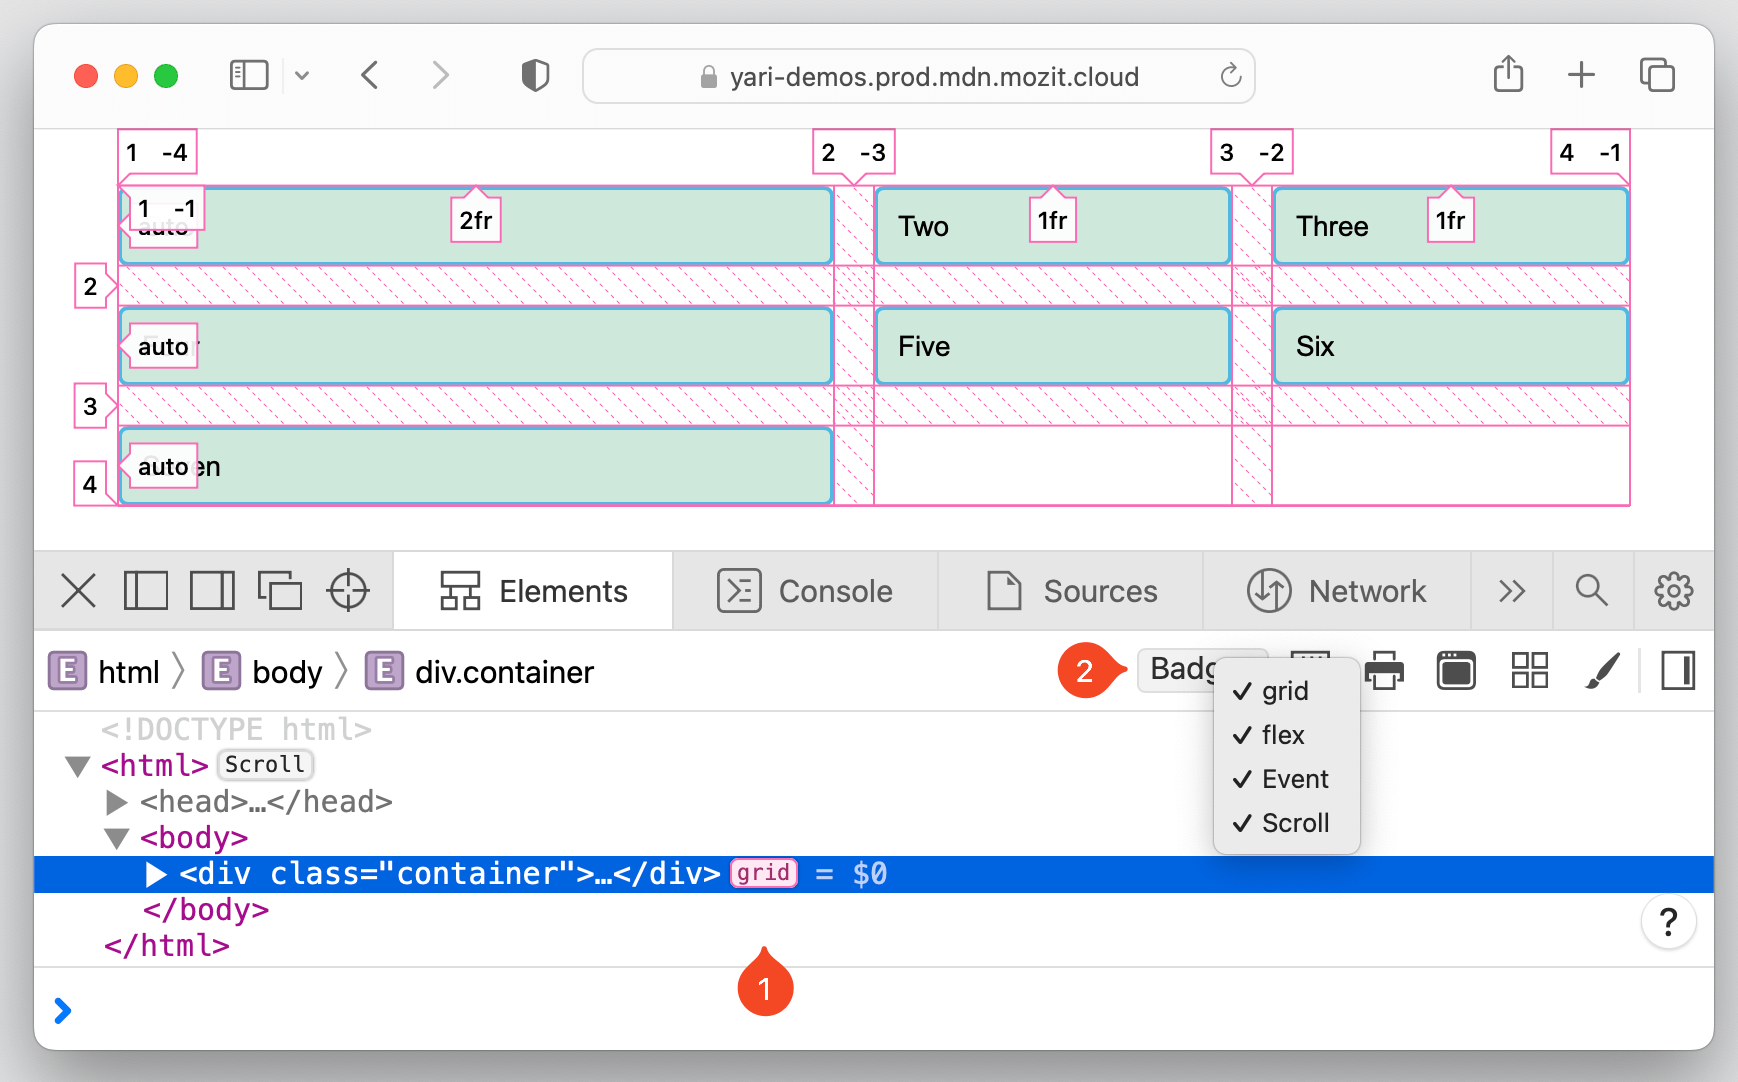
In Safari, there is a badge button in the Elements panel toolbar which can be used to toggle the visibility of specific badges. For example, if a node has a display: grid or display: inline-grid CSS declaration applied to it, a grid badge is displayed next to it. Clicking on the badge will highlight grid areas, track sizes, line numbers, and more, on the page.
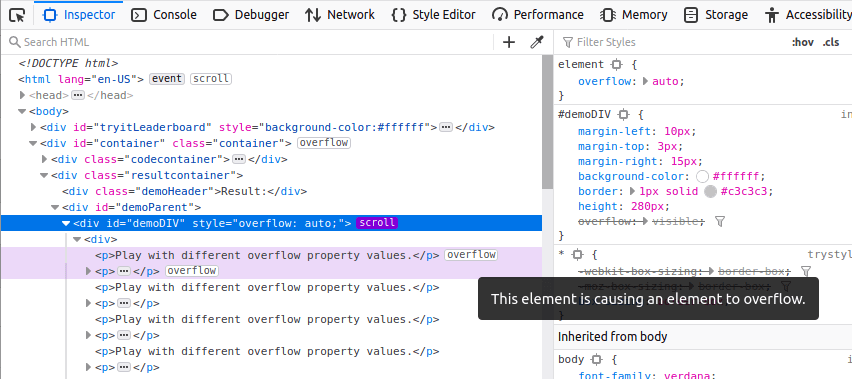
The badges that are currently supported in Firefox’s DevTools are listed in the Firefox source docs. For example, a scroll badge indicates a scrollable element. Clicking on the badge highlights the element causing the overflow with an overflow badge next to it.
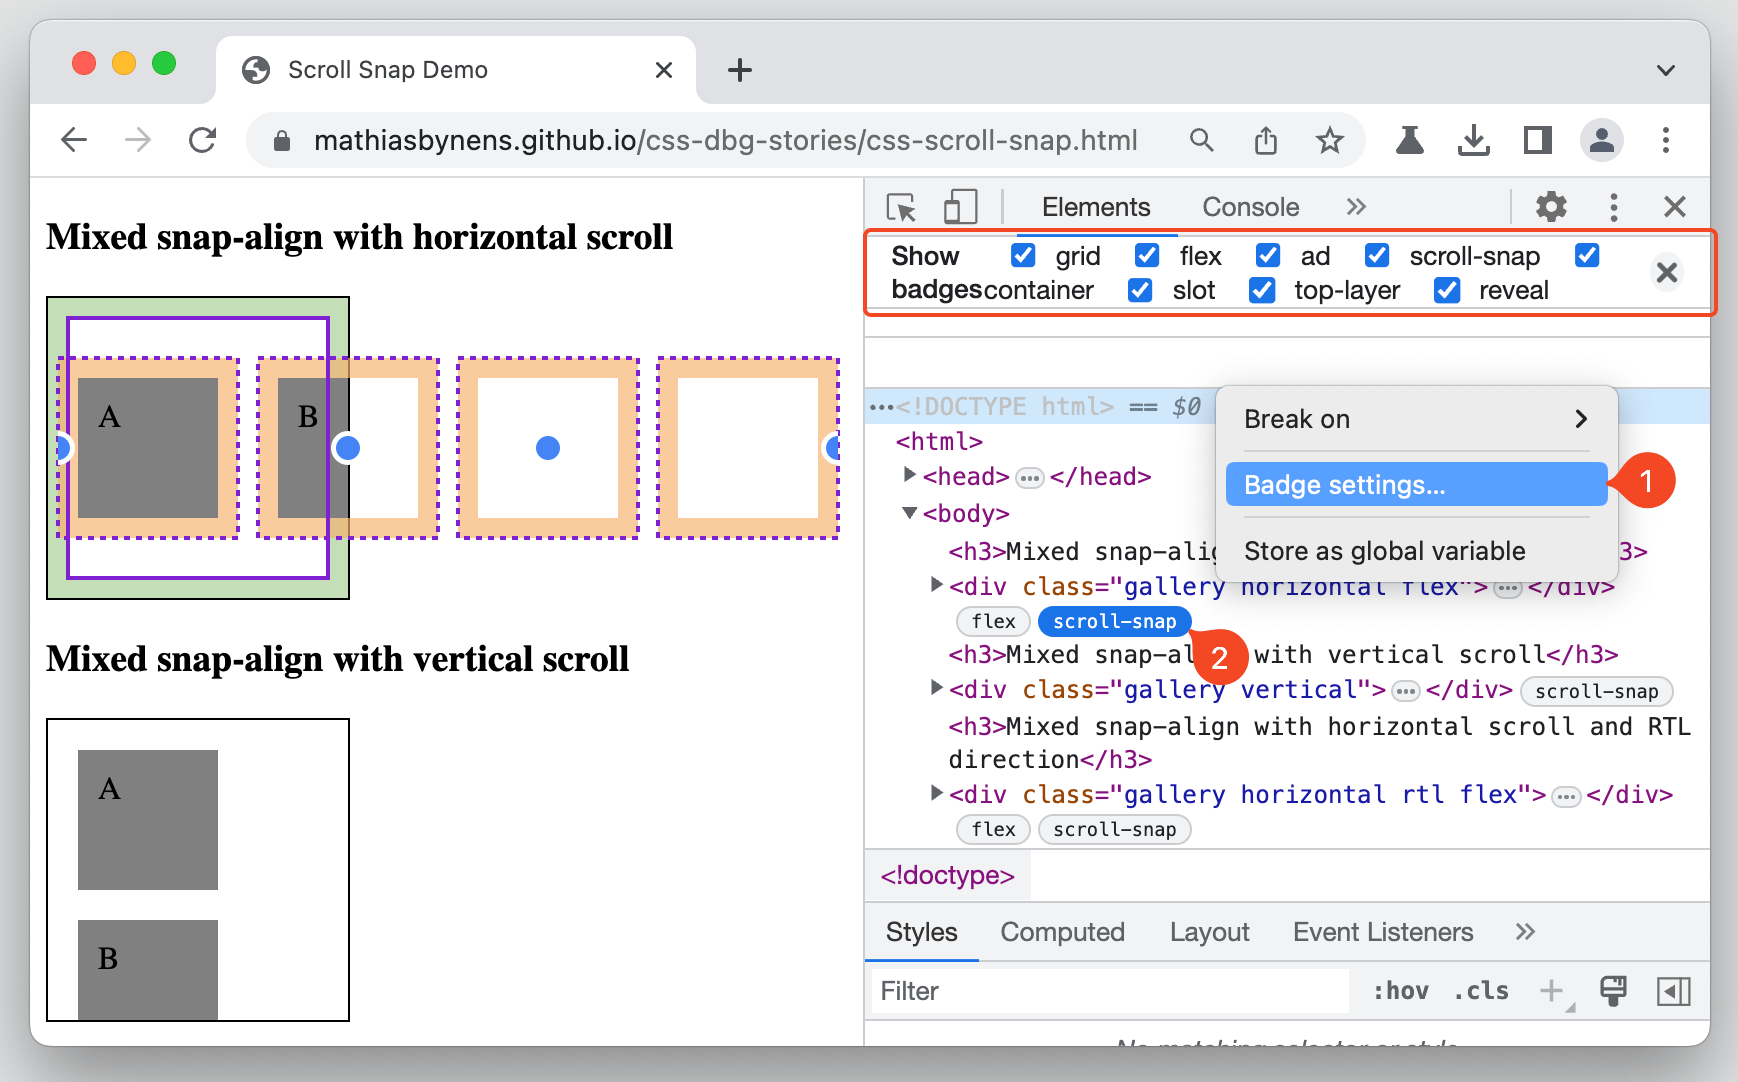
In Chromium browsers, you can right-click on any node and select “Badge settings…” to open a container that lists all of the available badges. For example, elements with scroll-snap-type will have a scroll-snap badge next to it, which on click, will toggle the scroll-snap overlay on that element.
Taking screenshots
We’ve been able to take screenshots from some DevTools for a while now, but it’s now available in all of them and includes new ways to take full-page shots.
The process starts by right-clicking on the DOM node you want to capture. Then select the option to capture the node, which is labeled differently depending on which DevTools you’re using.
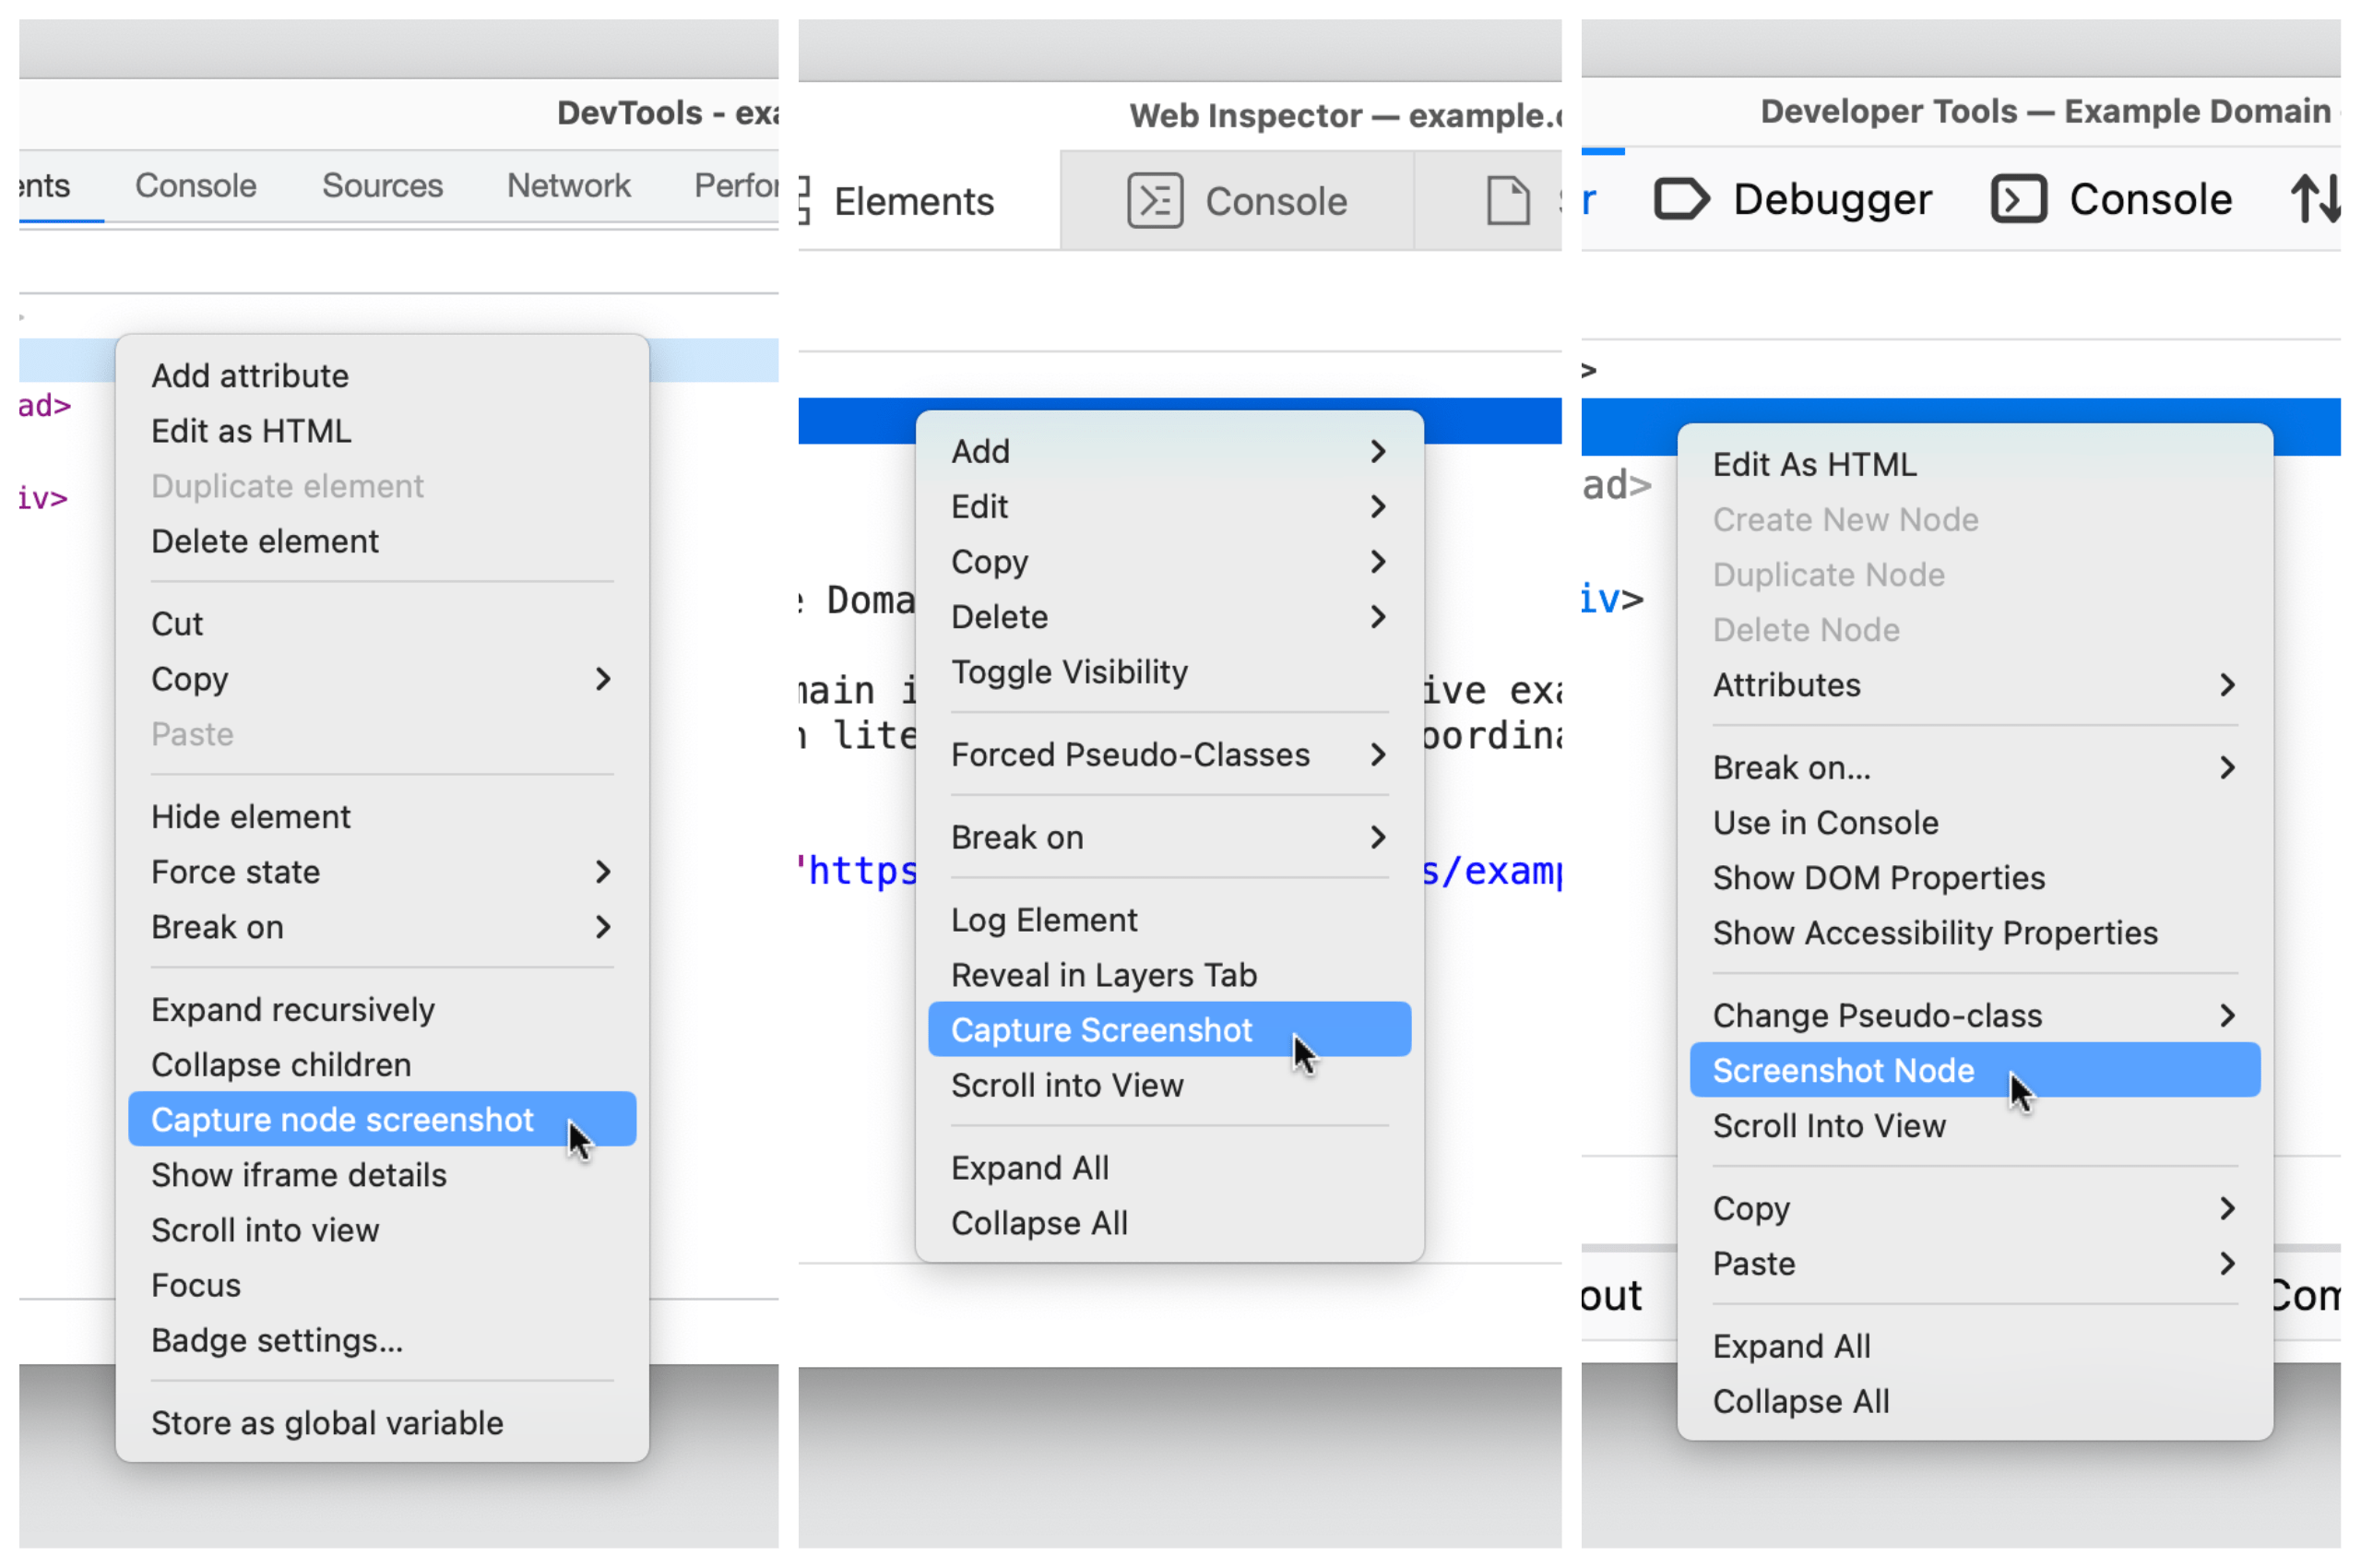
Repeat the same steps on the html node to take a full-page screenshot. When you do, though, it’s worth noting that Safari retains the transparency of the element’s background color — Chromium and Firefox will capture it as a white background.
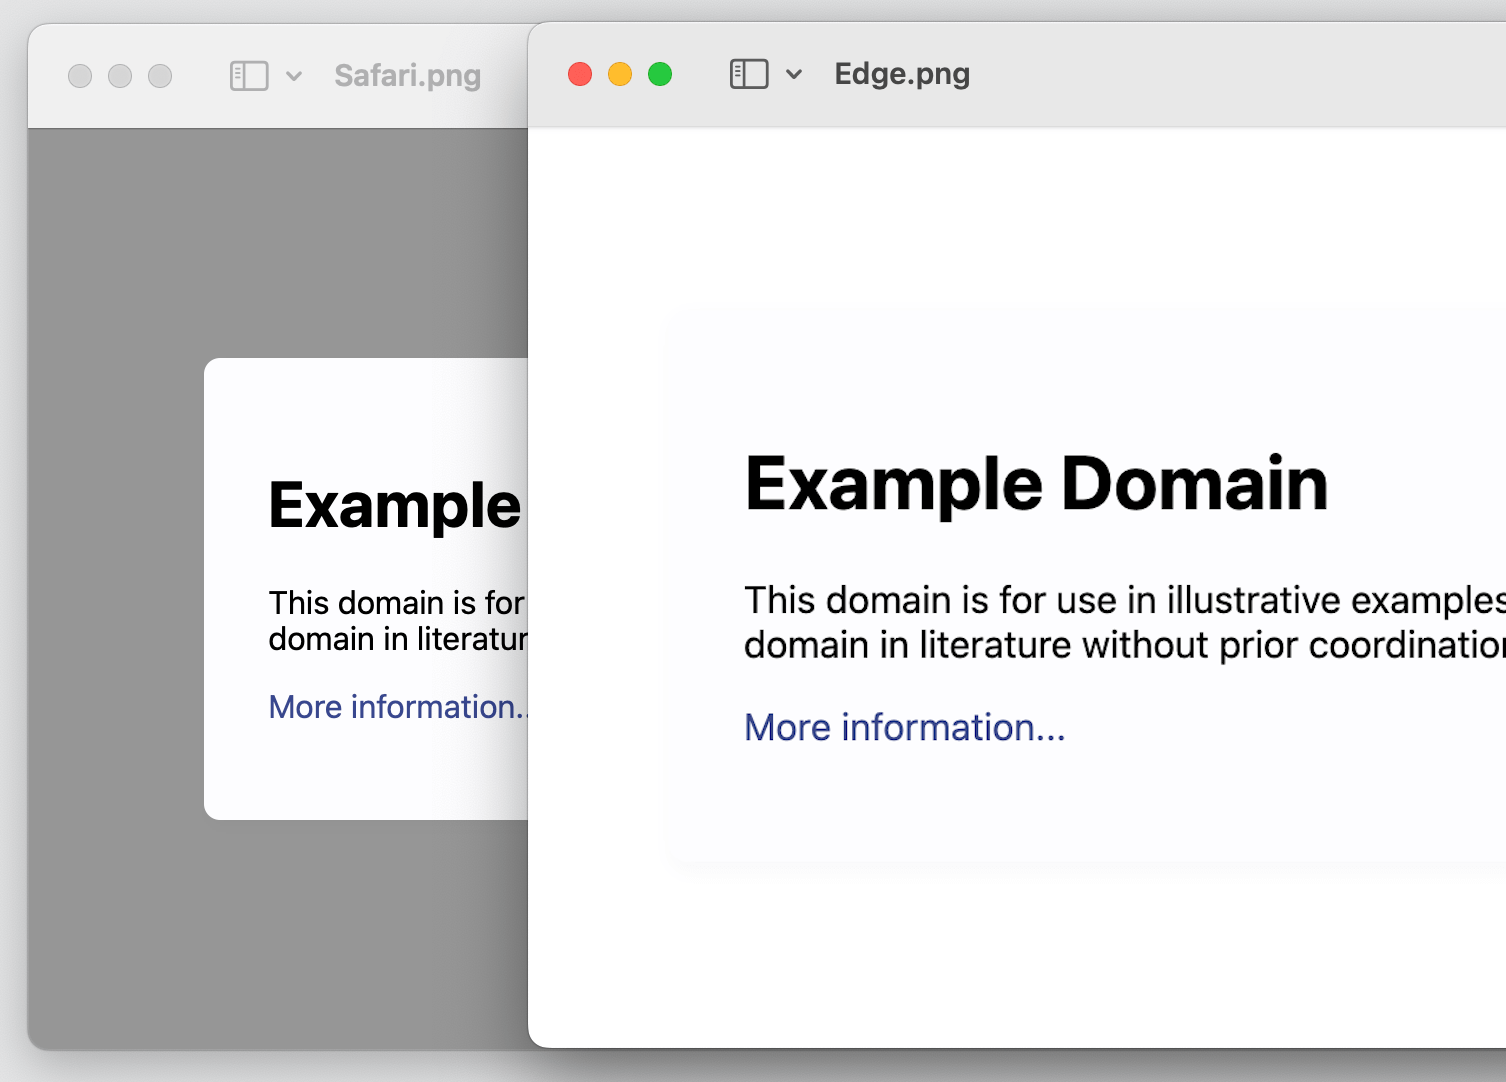
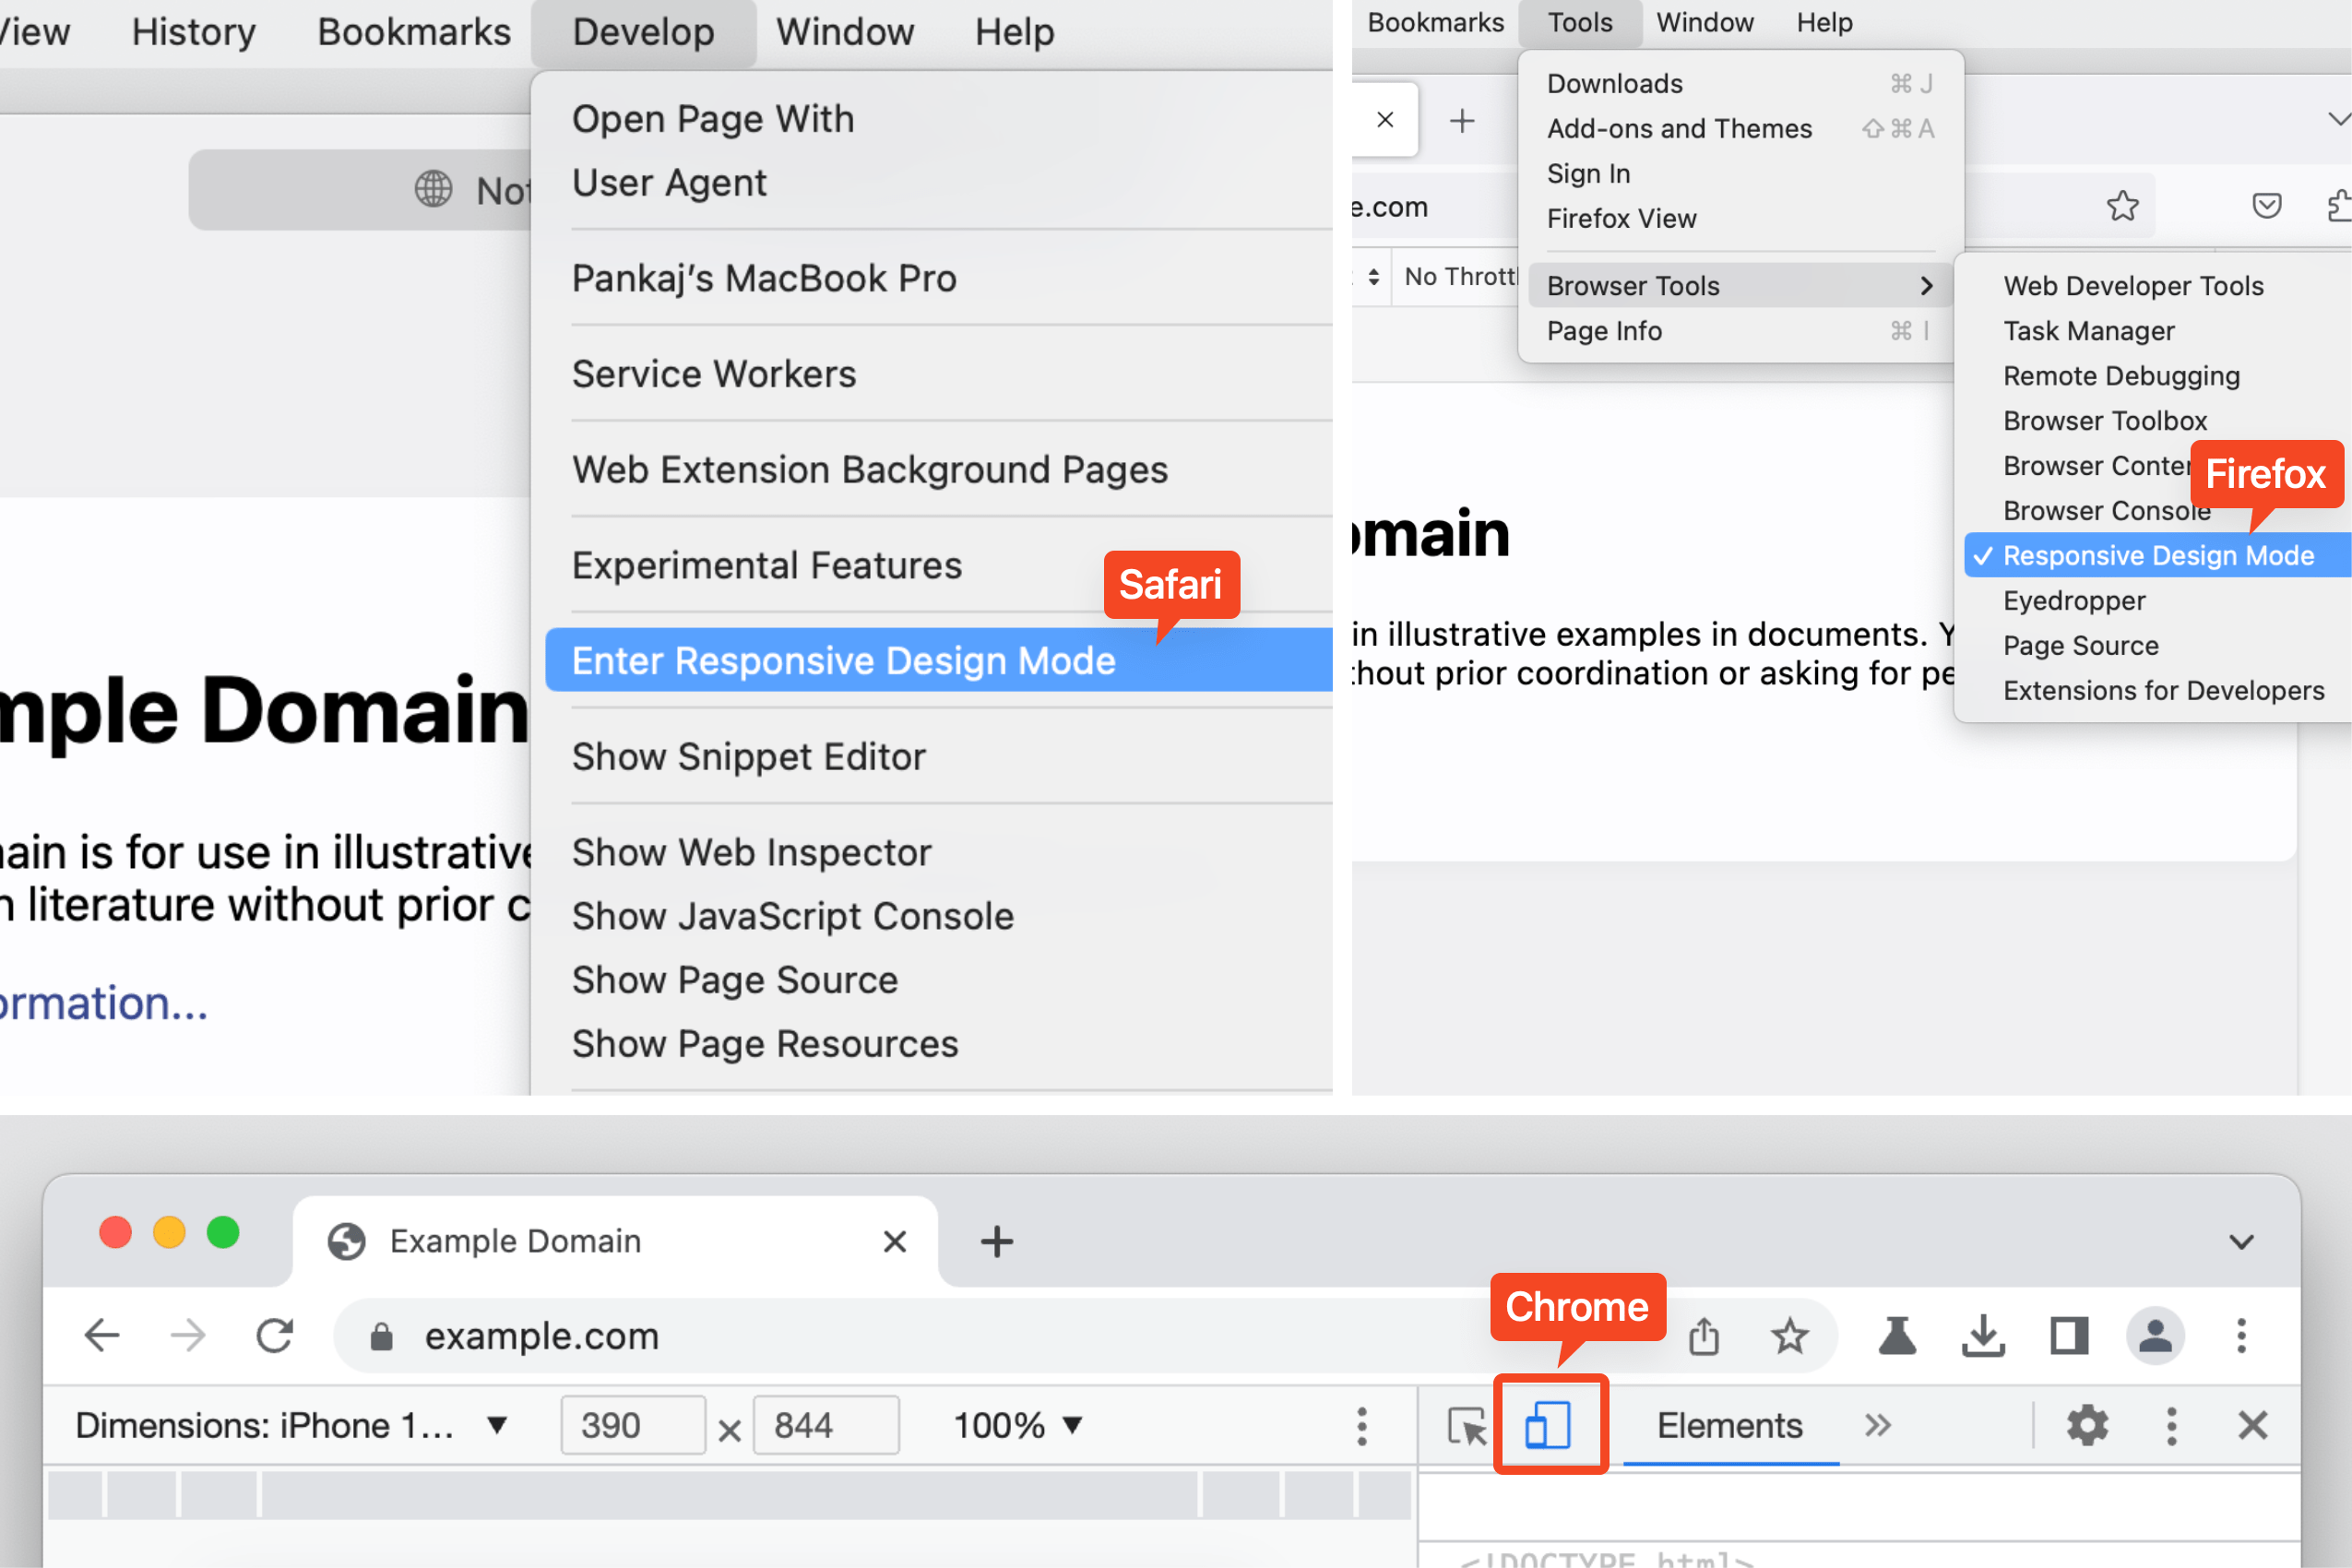
There’s another option! You can take a “responsive” screenshot of the page, which allows you to capture the page at a specific viewport width. As you might expect, each browser has different ways to get there.
- Chromium:
Cmd+Shift+M(macOS) orCtrl+Shift+M(Windows). Or click the “Devices” icon next to the “Inspect” icon. - Firefox: Tools → Browser Tools → “Responsive Design Mode”
- Safari: Develop → “Enter Responsive Design Mode”
Chrome tip: Inspect the top layer
Chrome lets you visualize and inspect top-layer elements, like a dialog, alert, or modal. When an element is added to the #top-layer, it gets a top-layer badge next to it, which on click, jumps you to the top-layer container located just after the </html> tag.
The order of the elements in the top-layer container follows the stacking order, which means the last one is on the top. Click the reveal badge to jump back to the node.
Firefox tip: Jump to ID
Firefox links the element referencing the ID attribute to its target element in the same DOM and highlights it with an underline. Use CMD + Click (macOS) or CTRL + Click (Windows) )to jump to the target element with the identifier.
Wrapping up
Quite a few things, right? It’s awesome that there are some incredibly useful DevTools features that are supported in Chromium, Firefox, and Safari alike. Are there any other lesser-known features supported by all three that you like?
There are a few resources I keep close by to stay on top of what’s new. I thought I’d share them with here:
- DevTools Tips (Patrick Brosset): A curated collection of helpful cross-browser DevTools tips and tricks.
- Dev Tips (Umar Hansa): DevTools tips sent to your inbox!
- Can I DevTools?: The Caniuse for DevTools.

I had the DOM problem is well on my php site, was getting a large amound of dom size in pagespeed insights, so I turned it to wp.
Hey Pankaj!
Firstly, major kudos on this deep dive into the world of DevTools! As an Online Marketing Agency, we’re always in the trenches trying to optimize our clients’ websites, and your insights are an absolute goldmine. Who knew navigating the complex world of DOM trees could be made so much simpler? Your tips on searching nodes in the DOM tree are already bookmarked for our team’s next troubleshooting session!
It’s fascinating how something as ubiquitous as DevTools can still hold so many lesser-known gems. Those badges to visualize elements? Absolute game-changer! And while we’ve been using screenshots in DevTools for a while, the insights on capturing full-page shots in different browsers and the nuances in each is super handy.
Your wrap-up, especially the resources you’ve shared, is like the cherry on top of an already delectable cake. We’re definitely signing up for those DevTips by Umar Hansa.
Thanks for lighting up the pathway for many of us, Pankaj. Your passion and dedication to sharing knowledge truly shine through this piece. Can’t wait to see what you’ll uncover next!
Warm wishes,
Šukri
Wow, the screenshot feature, I never noticed
Thank you for this article !