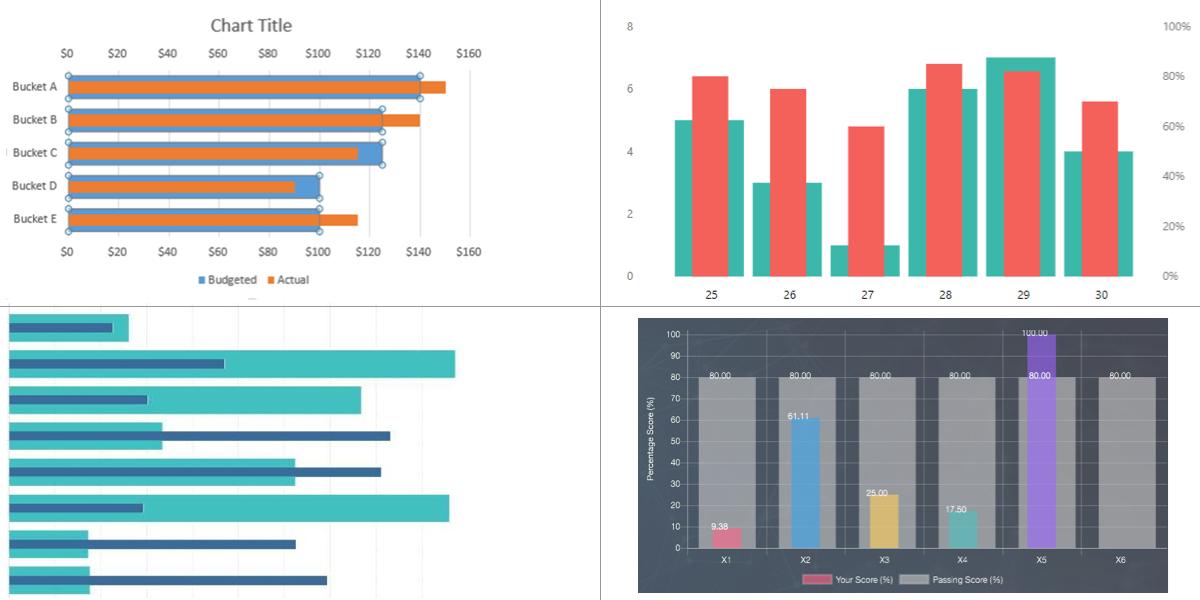
Overlapping Bar Charts
As the name suggests, overlapping charts visualize two different sets of data in a single diagram. The idea is that the overlapping bars allow us to compare data, say, year-over-year. They are also useful for things like tracking progress for …
